Is your campaign gift driving responses, or just driving up costs?
We put that question to our own $1.20 gift and tested it before trusting it. The gift lowered opens, and each response cost 2.8 times as much. Here is what happened, and how to test your own gift on a sample before it goes to the full list.

The live reveal page, exactly as recipients opened it. Press play, or open it full screen.
The live reveal page, exactly as recipients opened it. Press play, or open it full screen.
- organizations randomized
- 1,950
- sectors, 650 organizations each
- 3
- per arm: card alone, or card and gift
- 975
- Preregisteredon OSF, before the first card was mailed
- Independent replicationre-run from the frozen data; the signed statement publishes with the report
- Working paperfull methods, read the working paper
We tested the gift before trusting it with a budget.
Before scaling a direct mail campaign, you need to know if the extra weight is pulling its weight. We mailed 1,947 U.S. organizations a custom card with a unique SweetNote QR code. Half, chosen at random, got the exact same card plus a $1.20 navy pocket planner. Because the cards and the random assignment were identical, any difference in what people did is the gift’s doing.
- Control
- Card only
- Test
- Card + gift
- Assignment
- 50/50 at random, fixed when the QR codes were created
Here we were the sender. In your study, you are. SweetNote never prints, mails or supplies a gift: your mailing goes out through your usual vendor, and SweetNote gives every piece its own QR code, assigns who gets what at random, and measures what happens.
The card
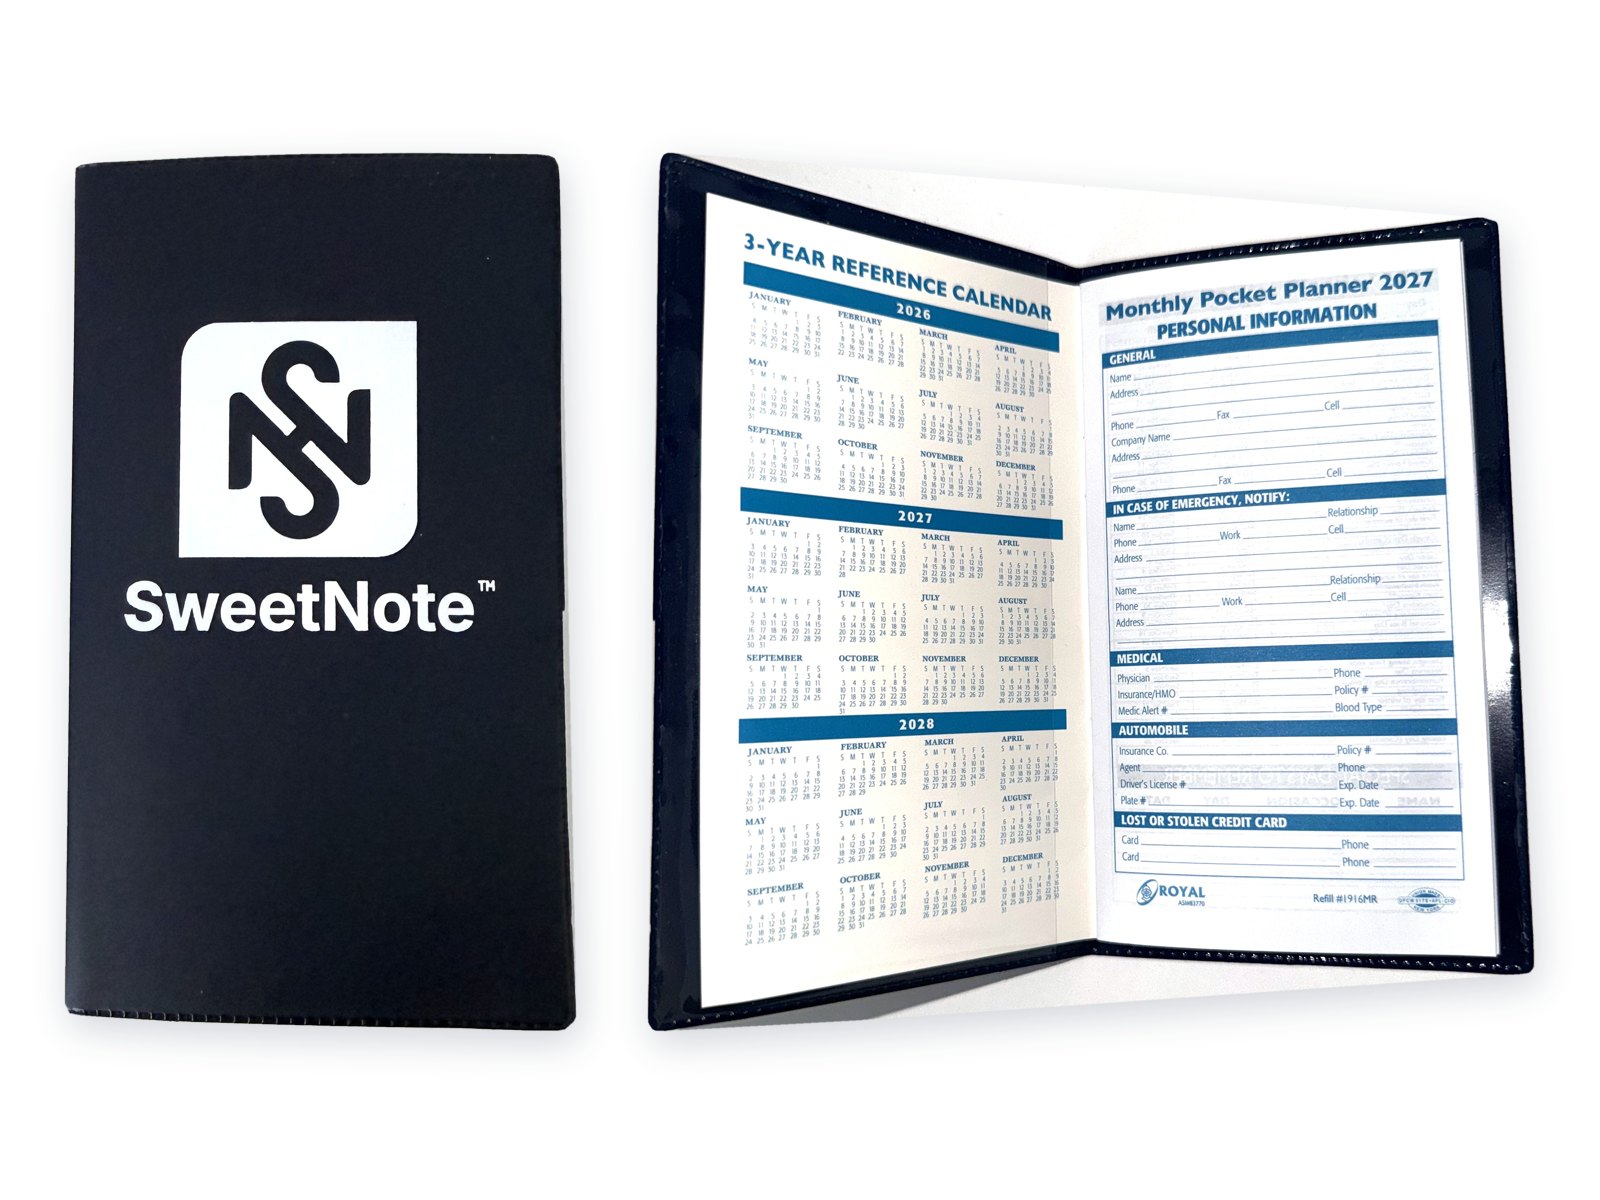
The $1.20 planner
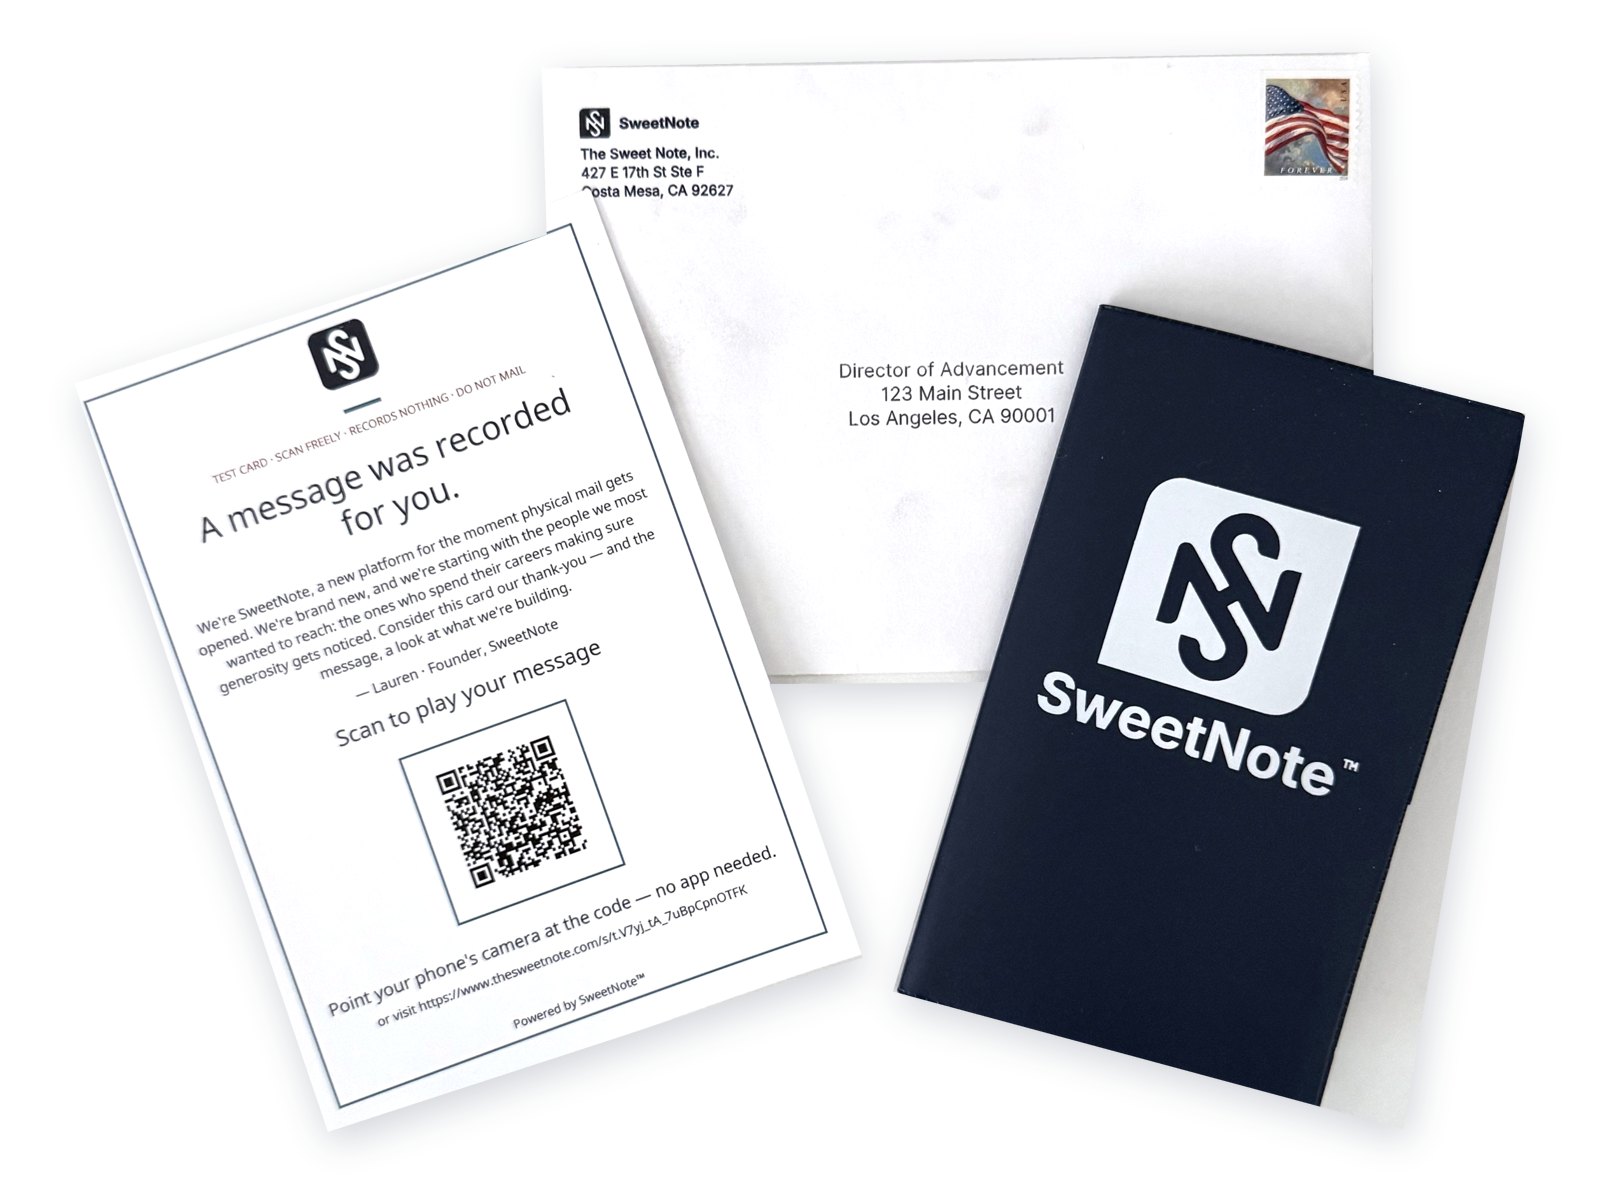
The package
How the two arms were set upWho was randomized and mailed, the stratification, the weight difference
- 1,950 organizations were randomized, 975 per arm. 650 each in university advancement, cultural institutions and national charities. 1,947 were mailed First-Class on 2 September 2026; 3 defective pieces were not mailed and stay in the analysis (how).
- The platform assigned each organization 50/50, server-side, at the moment its QR code was created, stratified on organization scale. No human chose who got the gift, and no mailing said which arm anyone was in.
- The same A7 envelope went to both arms. The test arm’s was heavier and thicker, a difference a recipient could notice before opening, which the pre-registration discloses rather than engineers away.
- The window was a fixed 30 days. Research ethics: ICC/ESOMAR Code · pre-mail determination on file.
- The card shown above is a test card, identical in layout; its code records nothing.
Here we were the sender. In your study, you are. SweetNote never prints, mails or supplies a gift: your mailing goes out through your usual vendor, and SweetNote gives every piece its own QR code, assigns who gets what at random, and measures what happens.
Not only did the gift not cover its cost - it backfired
A gift makes every piece cost more, so it has to bring enough extra response just to break even. To pay for itself, our planner needed to more than double our open rate (+106.5%). Instead, fewer people opened.
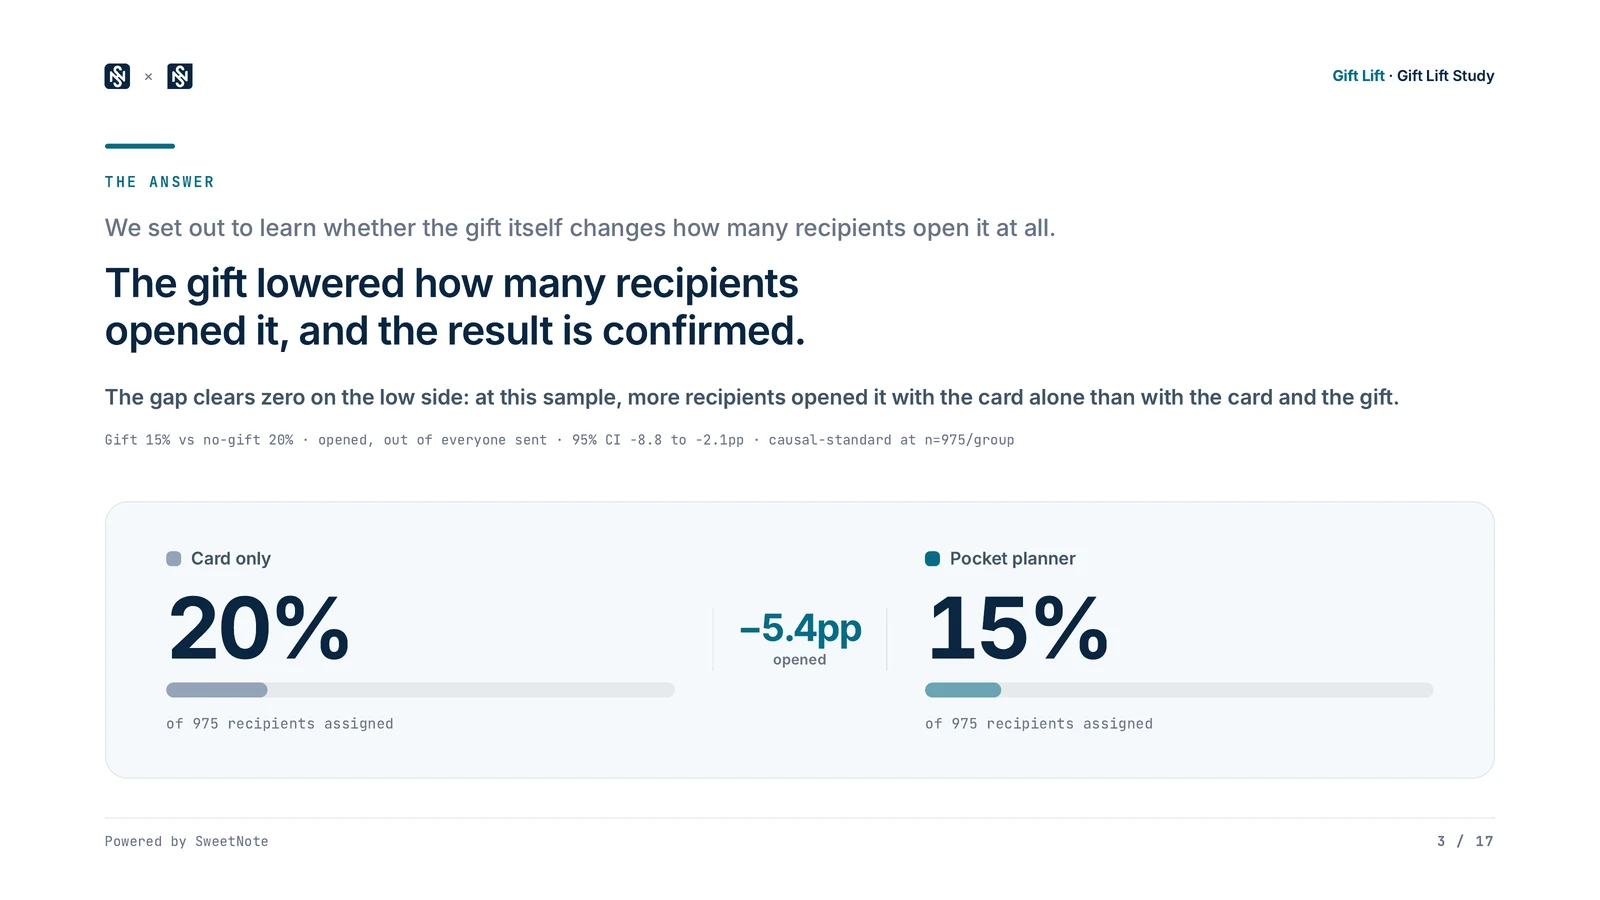
Opened it: the primary outcomeshare of the 975 per arm
The gap
26.8% fewer opened
likely range 11% to 40% fewer
About 5 fewer opens for every 100 sent−5.4 points, likely range −8.8 to −2.1
This answer is for this gift, this audience, this price.
What the gift needed, and what it gotchange in opens vs. card alone
likely range −39.7% to −11.1%
No part of the interval comes close.
Secondary outcomesPressed play, reacted, took the next step, came back: the full table
| Outcome | Controlcard only | Giftcard + planner | Gift ÷ control95% CI |
|---|---|---|---|
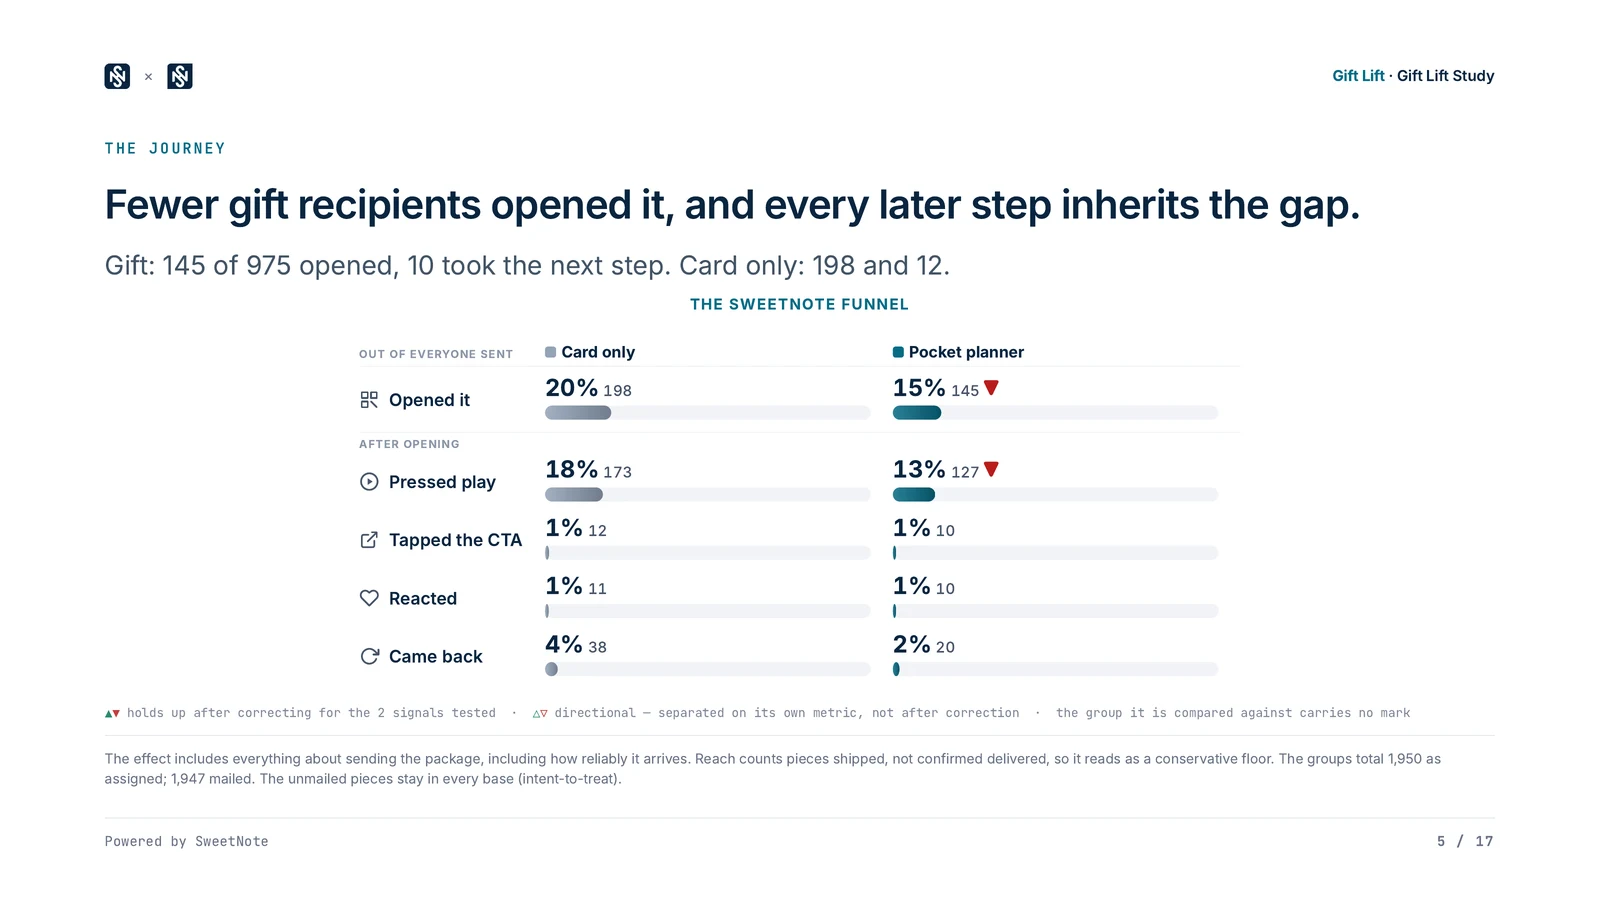
| Opened itReach · primary | 20.3%198 of 975 | 14.9%145 of 975 | 0.730.60 to 0.89 |
| Pressed playEngagement | 17.7%173 of 975 | 13.0%127 of 975 | 0.730.59 to 0.91 |
| ReactedAffirmation | 1.1%11 of 975 | 1.0%10 of 975 | 0.910.40 to 2.08 |
| Took the next stepAction | 1.2%12 of 975 | 1.0%10 of 975 | 0.830.37 to 1.88 |
| Came backRescanned | 3.9%38 of 975 | 2.1%20 of 975 | 0.530.31 to 0.89 |
Opened (Reach) is the registered primary outcome. Pressed play and Came back were also lower in the gift arm and still hold up after correcting for checking several outcomes at once; they are secondary outcomes, reported as hypothesis-generating for a subsequent study, not results to plan around. Reacted and Took the next step did not separate.
Methodology and statistical detailsThe registered verdict, the base every rate is on, the interval methods and the returned mail
- The registered verdict, word for word: “The gift did not pay for itself: the interval on its effect sits entirely below the break-even threshold we registered before mailing, so whatever the gift's true effect, it is smaller than the one that would justify its cost.”
- Every rate is on all 975 organizations assigned to each arm, whether or not they were mailed or reached. “Opened” means the organization scanned the card, which opens the reveal.
- The window was a fixed 30 days from activation, closed 2 October 2026. The registered analysis ran once on the frozen data, and an independent statistician re-ran it.
- Intervals are 95%: Wilson for each arm’s rate, Newcombe for the difference (−5.44 points, −8.81 to −2.06; p = 0.0016), and the risk ratio 0.73 (0.60 to 0.89), which is 26.8% fewer (11% to 40% fewer). The ratio sits wholly below 1 as well as below the 2.07 bar, so this is a lowered result, not a null one.
- This study measured whether the gift changed what people did, not why. The working paper discusses candidate explanations; none of them is a finding of this study.
- 23 pieces came back undeliverable (13 gift, 10 control). Dropping them, as a labelled sensitivity check, gives −5.45 points (−8.85 to −2.03). It is a complete-case check, not a bound.
Each response cost 2.8 times as much.
When response drops and cost per piece rises, cost per response climbs. That is the risk of scaling an untested assumption.
Measured cost ÷ measured opens (point figures)
Cost per organization that opened
2.8× as much with the gift
Opportunity cost, projected · the gift arm’s budget, $2,821, spent two ways
Projected: the same money as plain cards could reach about 264 more organizations, if the card-alone open rate holds.
As gift packages975 assigned (972 mailed), measured145 opened
Same money as plain cardsabout 409 opening198 measured, plus about 211 projected for 1,038 more cards
- Opened, measured
- Projection at the card-only open rate, not observed
- 1 dot = 10 organizations
The arithmeticCosts per piece, the projection and its one assumption
| Measured | Card alone | Card + gift |
|---|---|---|
| Cost per piece | $1.40 | $2.89$1.40 card + $1.20 planner + $0.29 extra postage |
| Organizations that opened | 198of 975 | 145of 975 |
| Cost per organization that opened | $6.90 | $19.46 |
Costs are the study’s own, settled from the print order and the post office rating, across all 975 organizations in each arm. The cost figures are point figures; the open rates behind them carry the intervals in 02.
The projection. The arm’s whole budget, 975 × $2.8934 = $2,821, mails 2,013 plain cards at $1.40: the 975 the card-alone arm received plus 1,038 more (the gift and its extra postage, $1,455). At the card-alone open rate (20.3%), 2,013 cards project to about 409 organizations opening: 198 measured plus about 211 projected. Against the 145 that opened in the gift arm, that is about 264 more.
The one assumption: the card-alone open rate holds for the extra cards. It might not, because extra cards reach organizations further down a list, and response can fall as a list widens. This is arithmetic on a measured rate, not something the study observed, and it adds no verdict.
Three things we learned.
-
A gift can lower response, not just fail to lift it.
Our planner cut opens by about a quarter (likely range: 11% to 40% fewer). The worst case for a gift is not zero. It is fewer responses, at a higher price per piece.
-
The break-even bar is higher than most assume.
A $1.20 planner, $1.49 with the extra postage it forced, on a $1.40 card had to lift response by +106.5% before cost per response stopped rising. Work out your own bar.
-
Stop guessing. Test on a sample first.
A randomized sample of your list answers the question while most of the budget is still in the bank. Then send the version that earned it to everyone else.
This gift, this audience, this price. A different gift, list or price can land differently, which is exactly why it is worth testing.
What your study delivers.
Every Gift Lift study ends in the same two places. The views below are this study’s own, rendered from its settled data.


Read the example report (the Gift Lift Study’s own deck)
Aggregate only. No recipient is named anywhere in either view. The data tables and a CSV export come with every study too. Price: this exact study, 1,950 recipients, is $10,124 at published prices, the same for every brand (the breakdown).
Money can be the outcome. Donations, renewals or purchases can be what your study measures, included at no extra charge and switched on by you at scoping. Your own systems match each conversion to the recipient’s anonymous code on your side; we tally it against the random assignment and report aggregates only, never a per-recipient amount. This study measured opens because we, the sender, had nothing to sell.
Will your gift pay for itself? Do the math.
This study’s outcome is specific to our gift, our audience, and our price. It doesn’t mean all gifts fail. It means you need to know your own break-even bar before you spend your budget. Use the calculator below to see how much extra response your gift must earn just to cover its own cost.
Example costs, or type your own. The answer updates as you type.
+106.5%more responses, just to break even
The point where cost per response stops rising. Not a revenue figure: that depends on what a response is worth to you.
Measured, registered, replicated.
We built SweetNote to replace marketing guesswork with measured answers, and we hold our own research to the same standard.
- PreregisteredHypotheses and the break-even rule registered on OSF before mailing.
- AuditedData frozen and re-run by an independent statistician; the signed statement publishes with the report.
- PublishedMethodology published in full; the statement publishes with the report.
Three verdicts, written before mailing. The data picked one.
The gift more than paid for itself- The gift didn’t pay for itselfPublished
The study can’t settle it
Read the ReportRead the Working Paper
Did one of these land on your desk?
Then you have already used the product: the reveal you opened is it. You are anonymous in everything we publish, and every recipient we can reach gets a debrief and a link to the full report.
Curious what your brand would see? Open an example reveal or explore the demo dashboard.

The public timeline
Before mailing
Registered
September 2026
1,947 of 1,950 mailed
30 days
Window open, verdict sealed
Locked 2 Oct · statement 12 Oct
Data frozen, independent replication
- Signed statement 12 Oct
October 2026
Report published
You are already mailing.
Physical reach works; the question is what works best for your campaign. Test it on the next send, on a sample of your own list, before the full budget goes out.
-
01 Start here
How is the moment landing?
Snapshot · no premium
Opens, plays, reactions and next steps, each read over everyone you mailed. The place to start.
1,200 recipients: $4,248
-
02
Which piece gets opened?
Gift Lift: two versions · Gift A/B: 2 to 5 gifts
Any difference in the physical mailing: gift or none, two designs, two formats, an insert or none. Randomized 50/50 and read on Reach over everyone sent, as this study was.
Gift Lift, 1,200 recipients: $8,248
-
03
Does the extra spend pay?
Gift Lift, with a gift
The question this study answered for our own gift. With Outcome Attribution on, donations, renewals or purchases can be the measure too.
1,200 recipients: $8,248. Can detect a gap of about 6.5 points at a 20% open rate.
This exact study, at the published price1,950 recipients, randomized 975 per arm
$10,124same price for every brand
- 975 per arm
- 30-day results window
- Results tab + report deck
A study this size can detect a gap of about 5 points at a 20% open rate, about the size of the gap this one found. The calculator quotes about 6, because it plans for the hardest case, a 50% rate.
$500 base + $5,624 for 1,950 recipients + $4,000 Gift Lift premium, before tax. Printing, postage and the gift stay with you, as ours did. A custom market-research firm often prices a standalone causal study like this at $30k to $50k (illustrative; quotes vary). Price your own list size.
Not ready yet? Get future study reports the day they publish.
One email when a study report publishes, and nothing else. No drip sequence, no sharing your address.