
Turn what you send
into a moment you can measure.
Add a QR code to the gifts and mailers you already send. The recipient scans, watches a short video from you, and reacts. You can now see how it actually landed. It’s the platform that’s both the moment and the measurement.
We measure the moment. Never the person. See what we capture →
Physical moments break through where digital can't. They're also the only channel that never reports back.
Physical mail is recalled better and takes measurably less effort to process than its digital twin — roughly 70% higher recall in neuromarketing testing. See the literature →
The package leaves your dock.
Digital alone can’t break through, so your team puts something physical in someone’s hand.
Then, nothing.
No view, no signal, no read. Whether it landed is anecdote at best.
Plan the next one. By guessing.
Real spend, real commitments, signed off on what felt right last year.
Every other channel gets tested. Now physical does too.
On digital, you test the creative, watch the numbers, and scale the winner. Your gifts, mailers, and event kits deserve the same.
The gift drove +12pp in Reach — openers per recipient sent, intent-to-treat (95% CI: +6–18 pp): it earns its place in the budget. Prove it on a sample first, then commit the full spend with confidence.
Choosing between two gifts instead? Gift A/B picks the winner the same way.
Real scan rates range widely with the gift, the audience, and the occasion: a mailed card can land in the single digits, an in-person gift can reach most recipients.
Every campaign gets sharper: test on a sample, see what actually resonates, then put your full budget behind the version that earned it — backed by evidence, not a hunch.

Turn anything you ship into a measurable moment.
Five steps. Same flow whether you ship 50 gifts or 100,000.
-
1
Set up Pick a methodology, brand the moment with your logo and colors, upload your recipient CSV.
-
2
Record Record one video for your whole list. The reveal greeting personalizes by name as on-screen text when you provide one. You provide the video — any message you want to send to your list.
-
3
Ship You ship through your existing fulfillment process. We just supply the unique QR for each recipient — we never print, ship, or sell what you send, so we have no stake in the answer. Just the honest read.
-
4
Engage Recipients scan the QR, watch the video, leave a reaction.
-
5
Measure Every engagement signal lives in your dashboard. Cohort filters from your CSV. Industry context as the network grows.
See how your recipients actually engage.
Pair any physical moment with a video reveal, and watch the engagement signal flow back.

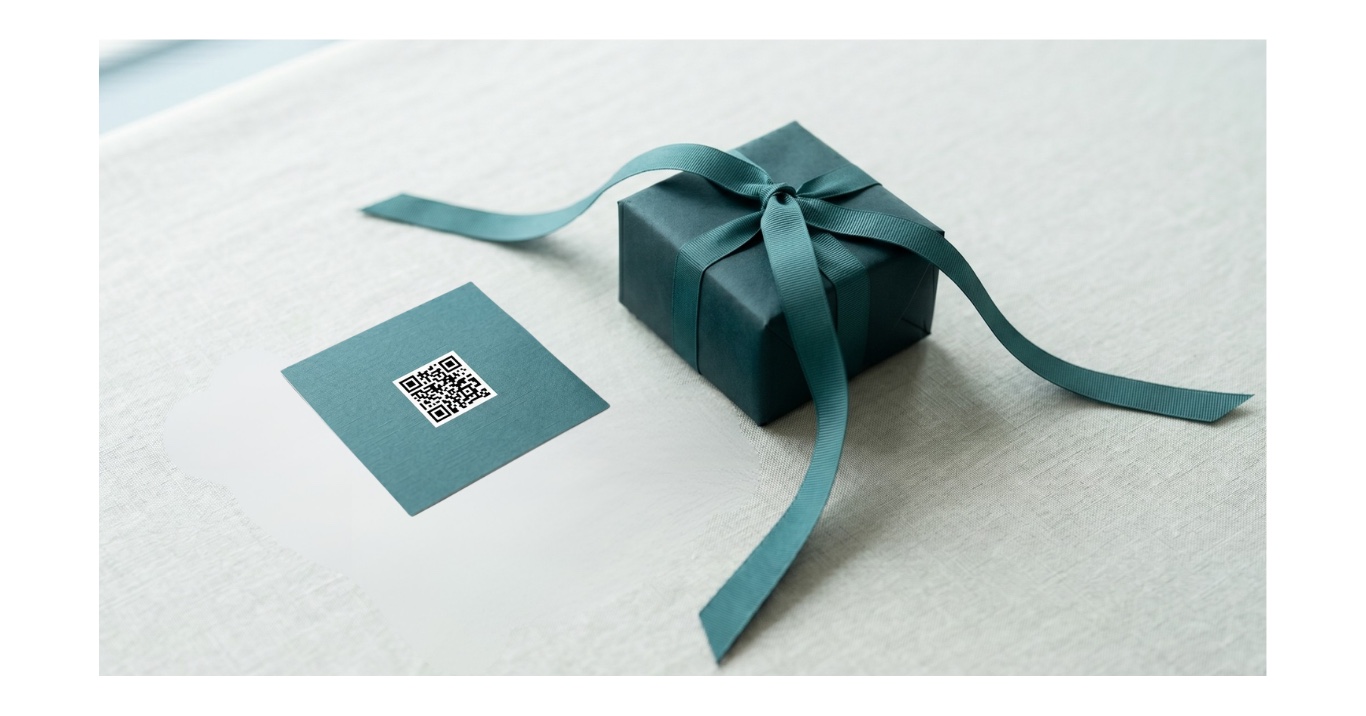
Physical card → QR scan → video reveal. The moment lives in your customer’s hand.
Open the live previewMake your marketing budget do your research, too.
Run one study and get both: the brand moment your customer holds, and the data on how it landed. We measure observed behavior, not stated intent. The research behind it.
A gift, hopefully appreciated.
A moment of brand contact your team can act on.
Pick the study that answers your question.
Start with the question you need answered. Each study design is built to answer a specific one.
Baseline result for one campaign. No comparison.
Same campaign, sliced by recipient segments.
Causal winner among 2-5 versions of your reveal.
Causal winner among 2-5 gift SKUs.
Gift vs no-gift. Causal lift you can attribute.
Find out if your gift actually keeps on giving.
Connect every scan, watch, and reaction to the business outcome that follows it. A donation. A purchase. A meeting booked. Included with every study and opt-in when you scope it, this optional layer attributes real outcomes back to the moment, with a causal estimate when the study is randomized.
-
1
Pick your methodology Any of the five. Closed-loop layers on top.
-
2
Send your conversion event One API call when the renewal, purchase, or signup happens on your side.
-
3
See the outcome in your dashboard Attributed alongside engagement, with the methodology context.
Opt-in per study

The real Insights dashboard, with a sample A/B study and sample data.See the example studies →
Watch every campaign land in one live dashboard.
Track every scan, watch, and reaction live, and compare it across your cohorts and the industry as the network grows.
-
Every signal, in plain language The core behavioral KPIs, plus watch-depth and closed-loop Outcome, each with a 25-recipient floorA rate shows once 25 recipients are in its base. Below that the count stays visible and the rate is withheld, never estimated — the floor gates the figures we compute for you, not your own counts. Naming a difference between groups takes more: at least 25 of them have to have taken the action being compared. and a margin of errorA Wilson confidence interval on every rate, so you see how sure a number is, not just the number. on every rate.
-
Cohort filters from your CSV Any column you upload as
cohort_*becomes a stackable filter chip. No setup required. -
Auto-generated deck at close A finished readout the day the window closes: descriptive on cohorts, causal on randomized.
Scale it across every physical item you send.
Start with gifting. The same platform covers direct mail, events, packaging, and hospitality, all on one contract and one dashboard.
-
Branded giftsCorporate, donor, recognition, VIP
-
Direct mailCatalogs, mailers, donor stewardship
-
Event swagConference sponsorship, summit kits
-
Premium packagingDTC unboxing, luxury launches
-
HospitalityIn-room, loyalty, milestone touchpoints

Reach your recipients. Measure what they actually do.
Pick a methodology, plug in a sample size, see the price. Same published number for every brand.